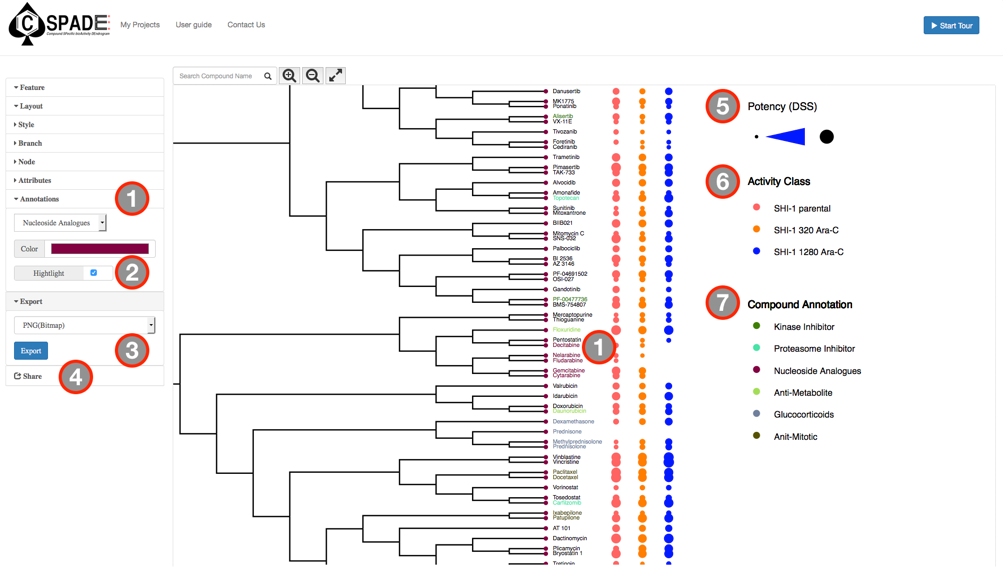
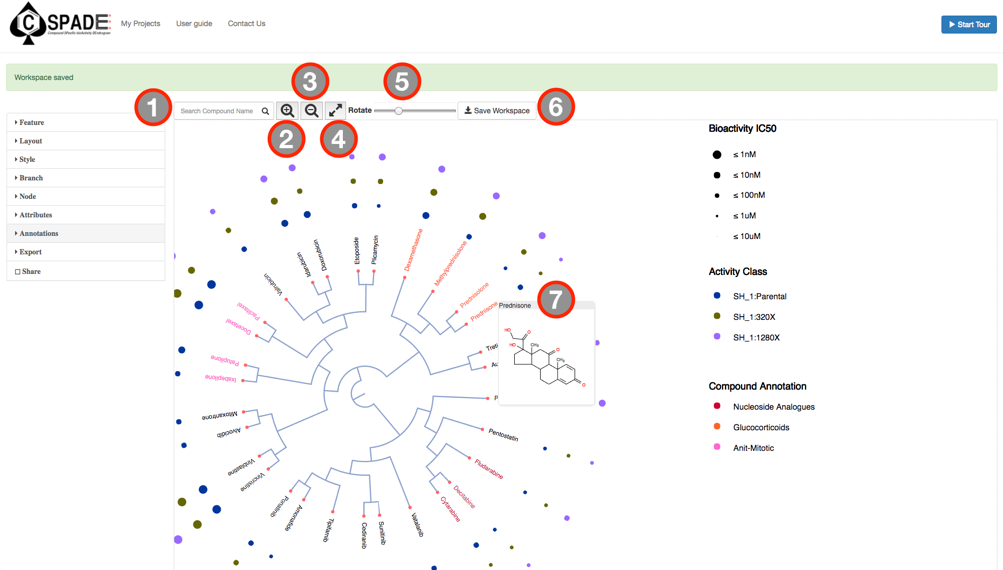
About

C-SPADE web-application serves as an interactive and innovative visualization tool for drug screening data. It reterives compounds structural information and clusters them based on their structural similarties, which is later visualized as a dendrogram of compounds augmented with their bioactivity values and other compound annotations. Additionally, it allows a real-time comparison of investigational compounds against a screening panel for drug development or repurposing applications. C-SPADE deals with various types of drug screening assays (biochemical, cell-based, cell-free). Tailored to be accessible to researchers with little to no chemoinformatics skills, it requires only the raw drug screening data as input and automatically calculates the structural information required for compound clustering, thereby significantly reducing the manual time required for such analysis.

Browser requirements

C-SPADE web application creates compound based similarity dendrogram designed for drug screening data. C-SPADE has not been designed for high throughput studies hence though very large compound trees can be visualized it is time consuming and memory intensive. C-SPADE has been checked for compatibility with standard modern browsers (Mozilla Firefox, Google chrome and Safari). Certain features of C-SPADE requires browser cookies hence make sure that browser privacy settings allow cookies to be stored.

User Information

C-SPADE can be directly accessed without any user login, registration, or providing any email address. On login, each user is provided an anonymous session where the user can upload one or more datasets and C-SPADE processes them simultaneously. The data uploaded by each user is secure and private to the specific browser session, which expires at the specified session expiry time displayed at the top in a notification bar. User has the possibility to bookmark the web address, close the browser, and revisit the address to resume the analysis.

When using C-SPADE, if you encounter any problem please contact the developer

Click to enlarge

C-SPADE  viewer user info

Figure 1: User information: (A) Home page. (B) My Projects page. (C) Feedback page. (1) Get Started button to login C-SPADE. (2) A quick tour of C-SPADE. (3) My projects tab for data upload and management. (4) User guide: redirects to the help page. (5) Contact Us: To contact the developers and (6) Feedback would result in a pop-up page (C) where the user can report a bug or provide feedbacks.

Example Data

The example data is a preprocessed subset of cell-based assay published by Malani, et al. The dataset contains 75 compounds screened across three types of cell-lines, with a subset of compounds annotated by the inhibitor type (e.g. proteasome inhibitor, nucleoside analogue, anti-metabolite etc).The summary measurments used is this study was Drug Sensitivity Score (DSS).

The various input data formts are provided as templates:

  • DSS as the assay read-out.

  • IC50 as the assay read-out.

  • IC50 with SMILES: Compounds with SMILES information.

  • Compounds only: With only th enique names of the compounds.

The user can choose to directly load the example data to C-SPADE by clicking on the Upload example data button, or choose to Download example data to manually inspect the data format.

Upload Data

To upload the input data, go to the My Projects page and select the Browse option, select the data that you want to visualize and click Upload. The input data should be a tab delimited file (.txt).

Click to enlarge

upload data-1

Figure 2: General information and Example datasets: (1) On login, the session expiry period is indicated in the notfication bar. (2) Projects table, list’s the files uploaded and their job status. (3) The Upload button to upload user specific input data. (4) Upload example data button (The templates for various input data formats). (5) Download example data button

The input file should include the following columns. COMPOUND(required): the unique names of the compounds used in the screen; SMILES(optional): the compounds whose SMILES information provided will be directly used by C-SPADE to calculate their structural features, otherwise, the compound names will be quired against the PubChem database to retrieve the SMILES; one or more assays(optional) (i.e. targets, cell-lines etc): with each assay in a separate column providing bioactivity values (IC50, EC50, Ki or Kd) or summary measurmenets (DSS or AUC); ANNOTATION (optional): additional annotation of the compounds (e.g. compound class) if available.

Click to enlarge

upload data-2

Figure 3: (A) Input file format. The first few rows of the Malani et al., dataset are shown. This file contains drug screening data obtained in a cell-based assay from three cell lines (SH_1:Parental, SH_1:320X, SH_1:1280X) with a panel of 75 drugs using IC50 assay measurements. A subset of the drugs are annotated with inhibitor type (glucocorticoids, anti-mitotic etc.).(B) The input data format with SMILES of the compounds if available.

On submission, for compounds whose SMILES information are not provided, C-SPADE queries PubChem database using the compound names and retrieves structural information of compounds as SMILES. Depending on the number of compounds, this process might take from few seconds to several minutes. During the retrieval process, the Data Preview icon appears in red color and is not clickable. This pages automatically refreshes every 30 sec, at this stage the user can choose to revisit the page after few minutes keeping the browser open, or bookmark the web address to revisit and resume the analysis. Upon completion, the Data Preview icon in the upload page will turn green.

Click to enlarge

upload data-3

Figure 4: Data Upload: (1) Notification to the user on successful upload of the file (any error in the input file will be notified here). (2) Title of various dataset uploaded with the file name as project titles. Mutilple dataset can be analysied simulateously, the active dataset will be highlighted in blue. (3) Enumeration of the number of compounds provided in the input file. (4) Data Preview tab: Status of reterival process. (5) Visual preview tab: Status of visulization process. (6) Data and Time of Upload (7) Project delete button (8) & (9) Data Preview icon and Viusal Preview icon will be red while processing and turns green once the process is completed. These icons also severs as button to redirect the user to the respective web pages.

Data Preview

On clicking the Data Preview icon in the upload page the user is redirected to the Data Preview page. Here the user’s input data are displayed in a tabular format augmented with two other columns, PubChem CID, the compound ID from PubChem database, SMILES the input or retrieved structural information of the compound. This page allows the users to manually edit, curate, filter and sort the data. The PubChem CID column contains the compound ID’s as hyperlinks to the PubChem database. Right-Clicking on the CID redirects the user to the PubChem Database with the compound information. Since C-SPADE relies on PubChem database for retrieving SMILES description, there can be cases where C-SPADE fails to return the SMILES. In such scenarios, the user is expected to provide SMILES of the compound for it to be included in the visualization. By default, all the columns with SMILES information will be selected, but the user can also select a subset of compounds for visualization (a minimum of 10 compounds are necessary to generate the dendrogram) through the select icon given in the far-left corner of the table.

Prior to visualization, the user should specify the type of activity measure (DSS, AUC IC50, EC50, Ki or Kd) that was used in the screening process, the default activity measure is DSS. These parameters along with the column names of the bioactivity values will be used as legends in the visualization workspace. The order in which the assay information are provided in the input data will be the order by which they are represented.

Click to enlarge

Data Preview

Figure 5: Data Preview Page: (1) Select icon: Subset of compounds can be selected to visualize (A minimum of 10 compounds should be selected for viuslaization). To select all compounds in a single click, checkbox next to the header can be used. (2) The PubChem Compound ID’s, they are hyperlinks to the compound information, right-clicking redirects the user to the PubChem database. (3) SMILES of the compound as obtained from PubChem (4) Preview of the user input data (Compound, Bioactivities and Annotations) with SMILES and PubChem CID information, a minimum of 25 rows of the input data is shown the user can select different number of rows to be displayed. (5) The appropriate Activity Measure that was used in the input data should be selected prior to visulation, these measures include (DSS, AUC, IC50, EC50, Ki or Kd) (6) Visualize button that redirects the user to the visual workspace.

Add Compounds

The user can choose to investigate the similarity of one or more investigational molecules to drugs in the screening panel through Add Compounds option. Selecting this option creates a new row in the generated table in real time, here the user is expected to give the name of the compound, the SMILES information and select the compound. These newly added compounds will be clustered with the selected compounds in the table.

Click to enlarge

Add Compounds

Figure 6: Add an investigational compound in real time to compare it with compounds used in the screening experiment. (1) Add Compound button to add new compounds (2) Generates a new row at the top of the table where the user should provide the compound name, structural information as SMILES and select the compound. (3) Data Preview page facilitates the user to edit, filtered and sort the input data. (4) Visualize button to visualize similarity dendrogram including the newly added compound.

Visualization

When the user clicks on Visualize, the user is redirected to the Visualization workspace. The visualization workspace is an interactive and dynamic platform in C-SPADE that allows the user to:

  • View and analyze compound similarity cluster and bioactivity values.

  • Customize the appearance of the dendrogram.

  • Download and share the results.

Once the clustering is calculated and the visual workspace is ready to be viewed, the Visual Preview icon in the My Projects page will turn to green and is clickable.

Main Interface

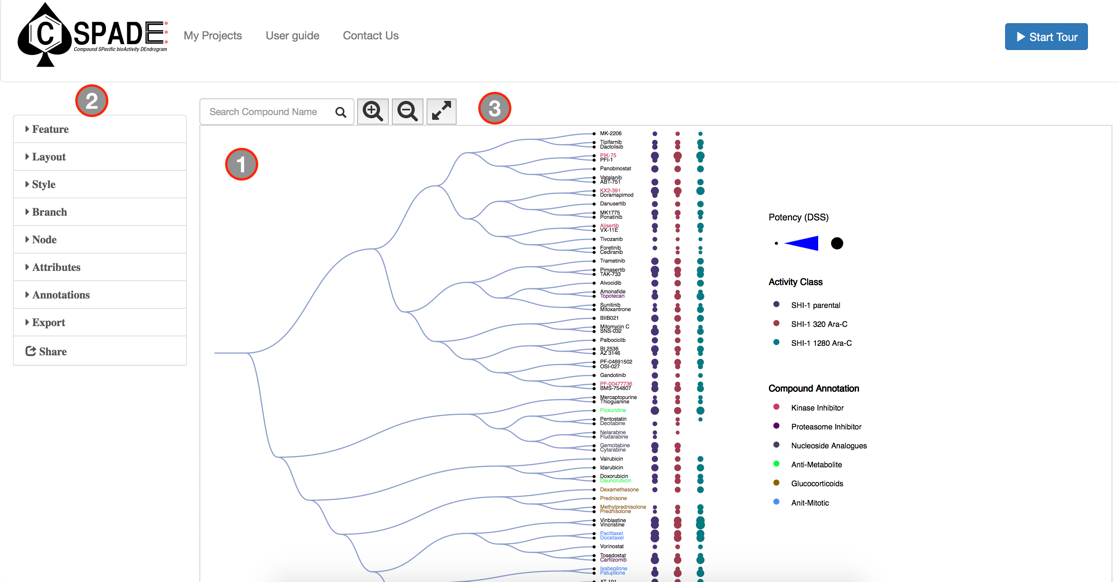
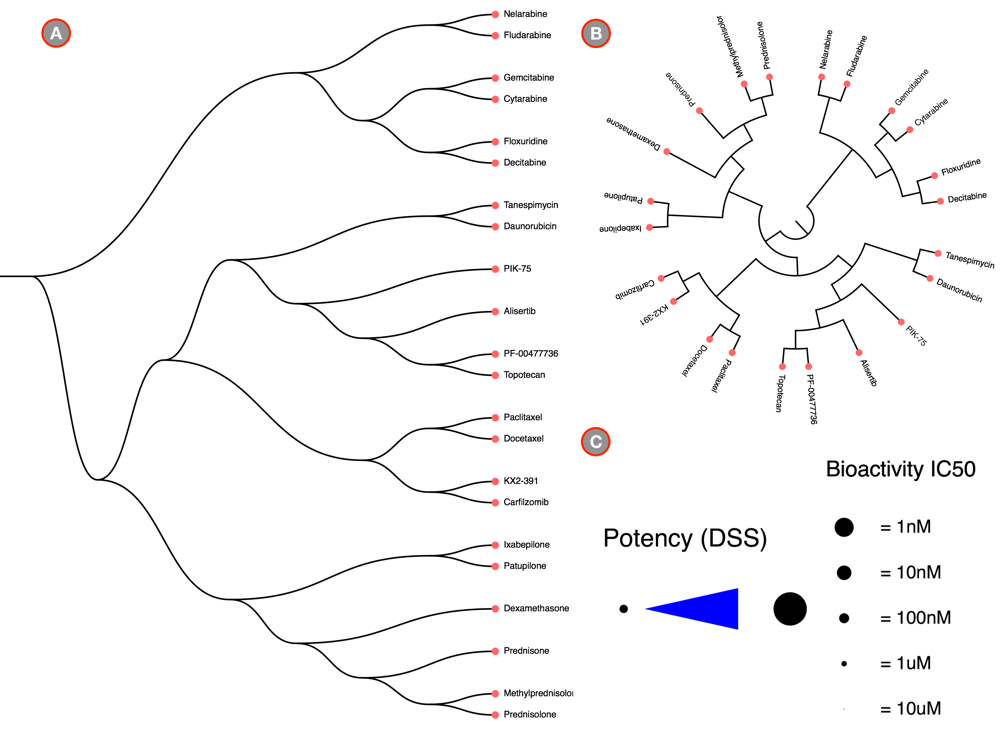
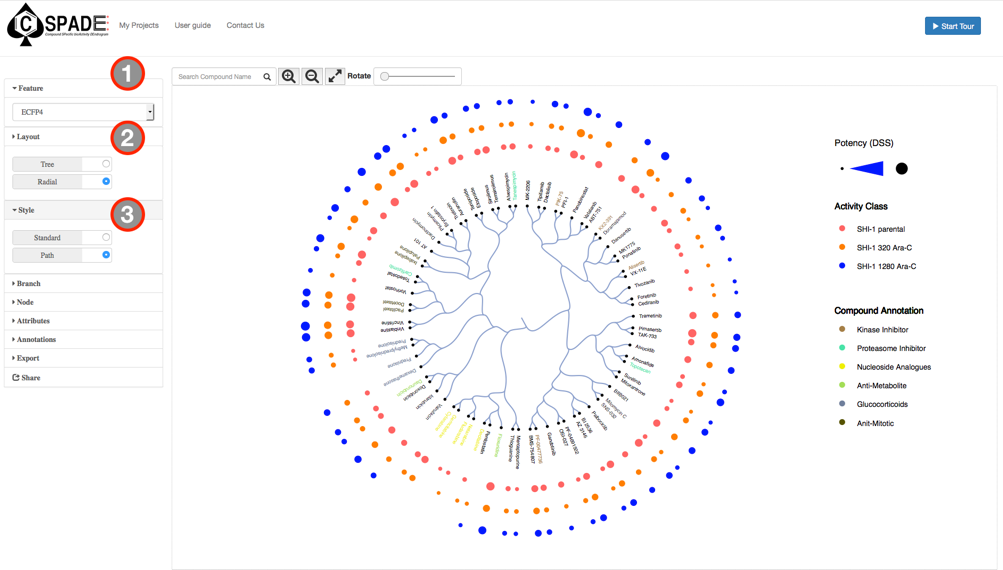
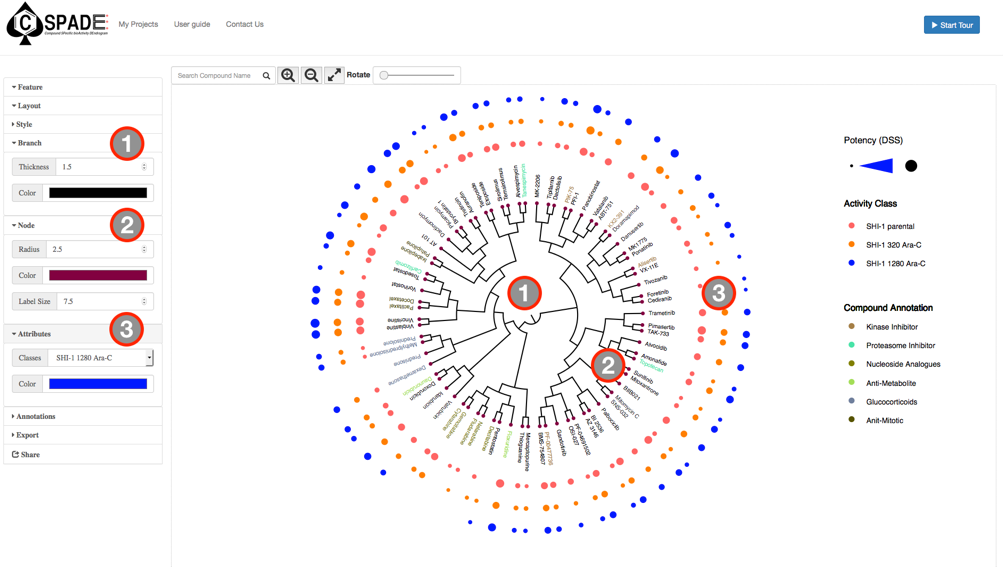
The main visual interface displays the compound similarity dendrogram, by default the compound similarity is estimated using the ECFP4 fingerprints, represented as Tree and the edges displayed as Path. The compounds that were selected in the Data Preview Page will be the nodes and the distance between two nodes is an estimate of their similarity. The compound names will be the labels of the node and the activity measure given in the input data are categorized into five potency classes using log-transformed IC50, EC50, Ki, Kd values (≤1nM, ≤10nM, ≤100nM, ≤1uM, ≤10uM); With the the summary measurements, such as AUC and DSS, the actual bioactivity values are used and represented as circular annotations in the dendrogram, the radius of which corresponds to the categorized bioactivity measure provided and is displayed in the Bioactivity legend and the color coding uniquely representing the various assays are shown in the Activity Classes legend. Annotation of the compounds if provided will be displayed with unique color and shown in the Compound Annotation legend.

Features

ECFP4 fingerpints are used to calulate the compound similarity, the feature options allows to user to select other fingerpint features such as (ECFP6, MACCS , Daylight or Atom-Pair) to generate the compound cluster dendrogram.

Layout

The layout options allows the user to visualize the similarity dendrogram as a standard hierarchical Tree cluster or as a Radial cluster.

Click to enlarge

layout

Figure 8: Layouts, Styles and Bioactivity legends in C-SPADE. (A) & (B) Shows the types of layouts (Tree or Radial) and Styles (Path or Standard) avaibale in C-SPADE. (C) Shows the two representations of bioactivty legneds in C-SPADE, for summary measurements (DSS and AUC) the actual potencies are dispalcyed, in case of IC50, EC50, Ki or Kd the activity measurements are catergorized and displayed.

Style

The style options controls the representation of the tree branches in the dendrogram, the user can choose to represent the tree edges as Standard edges or as Paths.

Click to enlarge

Views

Figure 9: Features, Layouts and Views in C-SPADE. (1)Feature options (MACCS, ECFP4, ECFP6, Daylight) as drop down menus.(2) Layout options (Tree, Radial). (3) View options (Standard, Path).

Branch

The Thickness and Color of the branch in the dendrogram are contolled using this option.The default branch thickness is 1.5.

Nodes

The nodes in the tree are represented as circles with a default radius of 2, the user can change the Radius of the node and there Color using this option. The node labels font size can also be dynamically adjusted using the Label Size option, the default font size is 7.

Attributes

Each Activity Classes (targets, cell-lines or other features) (targets, cell-lines or other features) provided in the input data will be assigned to randomly color and displayed as circle corresponding to each compound.The Attributes options is a sidebar menu allows the user to select and alter the Color code for specific classes, which will be automatically updated in the legends. The activity values are either categortized (=1nM, =10nM, =100nM, =1uM, =10uM) for IC50, EC50, Ki, Kd measurements or for DSS and AUC the actual bioactivity values are augumneted with the activity measure and displayed in the Bioacvity legends. Each activity classes and their respective color codes are displayed in the Activity Class legend.

Click to enlarge

Attributes

Figure 10: Branch, Nodes and Attributes in C-SPADE. (1) Branch options: Thickness and color. (2) Node Options: Radius, Color and Label font size. (3) Attributes options: Activity Class-The different classes of activity given in the input data, Color of the classes.

Annotation

The compound annotation if provided for various compounds will be color coded. Similar to attributes option, the user can select individual compound classes and change the Color codes, which will be automatically updated in the legends. Selecting the Highlight check box will display the Compound Annotation legend.

Export

Through the export option the user can download the visual worksapce as .png file or a .pdf file. In case of larger tree, the user can download the compound similarity dendrogram as a Newick tree file (.nwk).The user can also choose to share the workspace through the Share option that generates a hyperlink of the visual workspace.

Click to enlarge

Export

Figure 11: Annotation, Export and Legends in C-SPADE. (1) Annotation options: The different Compound annotation provided by the user in the input data is highlited with a distinct colour and can be switched on/off by the highlight checkbox (2). (3) Export options: The user can either export the image as a .png, .pdf or .nwk format using the export option or choose the share (4) the workspace through the Share option. (5) Bioactivity Legend: The Activity Measure provided by the user (if IC50, values will be catergorized) is plotted as circles with the highest affinity value having the biggest radius and the lowest affinity value with the smallest radius. (6) Activity Class Legend: The Attribute classes foreach cell-lines/samples are colour coded distinctly. (7) Compound Annotation Legend: The various compound annotations in the input data will be colour coded and shown.

Tool Bar options

Mouse Hover: Hovering the mouse pointer over a the bioactivity bubbles or a compound name displays a tooltip that shows the input bioactivity value or structure of the compound respectively.

Search bar: To search a Compound’s name in the dendrogram, the user can make use of the search bar, the compound,if present in the dendrogram will be highlighted in yellow.

Zoom + : The zoom in button facilitates the user to zoom into the main interface this functionality is also augumented with the mouse scroll wheel of the mouse.

Zoom – : The zoom out button facilitates the user to zoom out the main interface,this functionality is also augumented with the scroll wheel of the mouse.

Fit to screen : By clicking fit to screen button, the generated dendrogram will be optimaly fit to any display screen.

Pan: By holding the left-click button or the scroll-wheel in the mouse the user can Pan the generated dendrogram conveniently.

Rotation: An option only available for Radial cluster visualization, allows the user to rotate the clustered tree to any desireable angle.

Save Workspace: The user can save the changes made in the visual interface for each session using this options, hence the changes are restored when the session is revisited.

Click to enlarge

Tool Bar

Figure 12: Tool Bar options. (1) Compound search bar. (2) Zoom In. (3) Zoom Out. (4) Fit to screen. (5) Rotating the radial dendrogram. (6) The Save Workspace option. (7) Hovering over the compound names or bioactivity annotations displayes the compound structure or the input bioactivity value.

Dependencies

  • The backend computation is implemented using Python (version 2.7.12).

  • The compound fingerpirnts are calculated using the RDKit module in python (version 2016.09.1).

  • The Scipy module (version 0.13.2) is used to calculate the hierarchical clusing using the compound similarity estimate.

  • The compound structural images are generated using the SMILES information through Open Babel (version 2.3.1).

  • The interactive visualization was impletmented using D3 (http://d3js.org/) Javscript library.